Back to Projects
Swiggy Restaurant Data Pipeline
Overview
This project develops a data engineering pipeline to analyze restaurant data from various cities on the Swiggy platform. Using PySpark, Spark SQL, and Azure Data Factory, the data is processed and transformed to generate insights on ratings, cuisines, and trends, presented through databricks dashboard.
Features
- Data Ingestion: Data from JSON sources is ingested into Azure Data Lake using Azure Data Factory.
- Data Transformation: PySpark is used to cleanse, transform, and aggregate the data.
- Data Quality Assurance: Techniques to ensure data accuracy and consistency, including null handling, and integrity validation.
- SQL Analysis: Spark SQL queries to extract insights on delta tables.
- Visualization: Dashboards created using Databricks to visualize restaurant trends.
- Audit Logging: Execution logs for process monitoring stored in Azure Log Analytics workspace and tables.
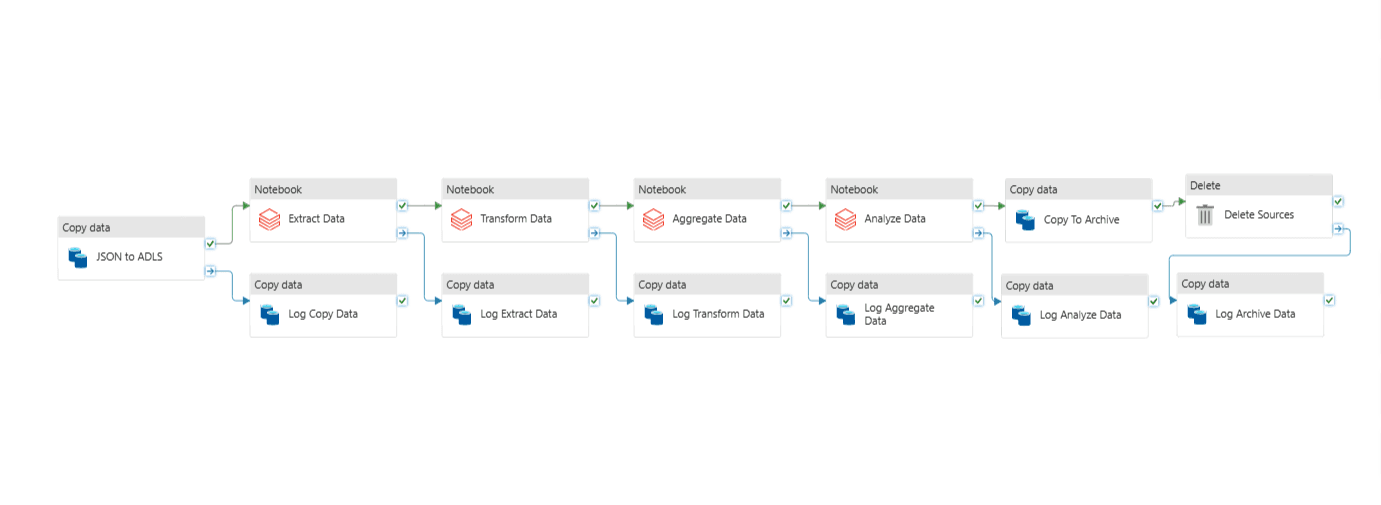
Pipeline Overview
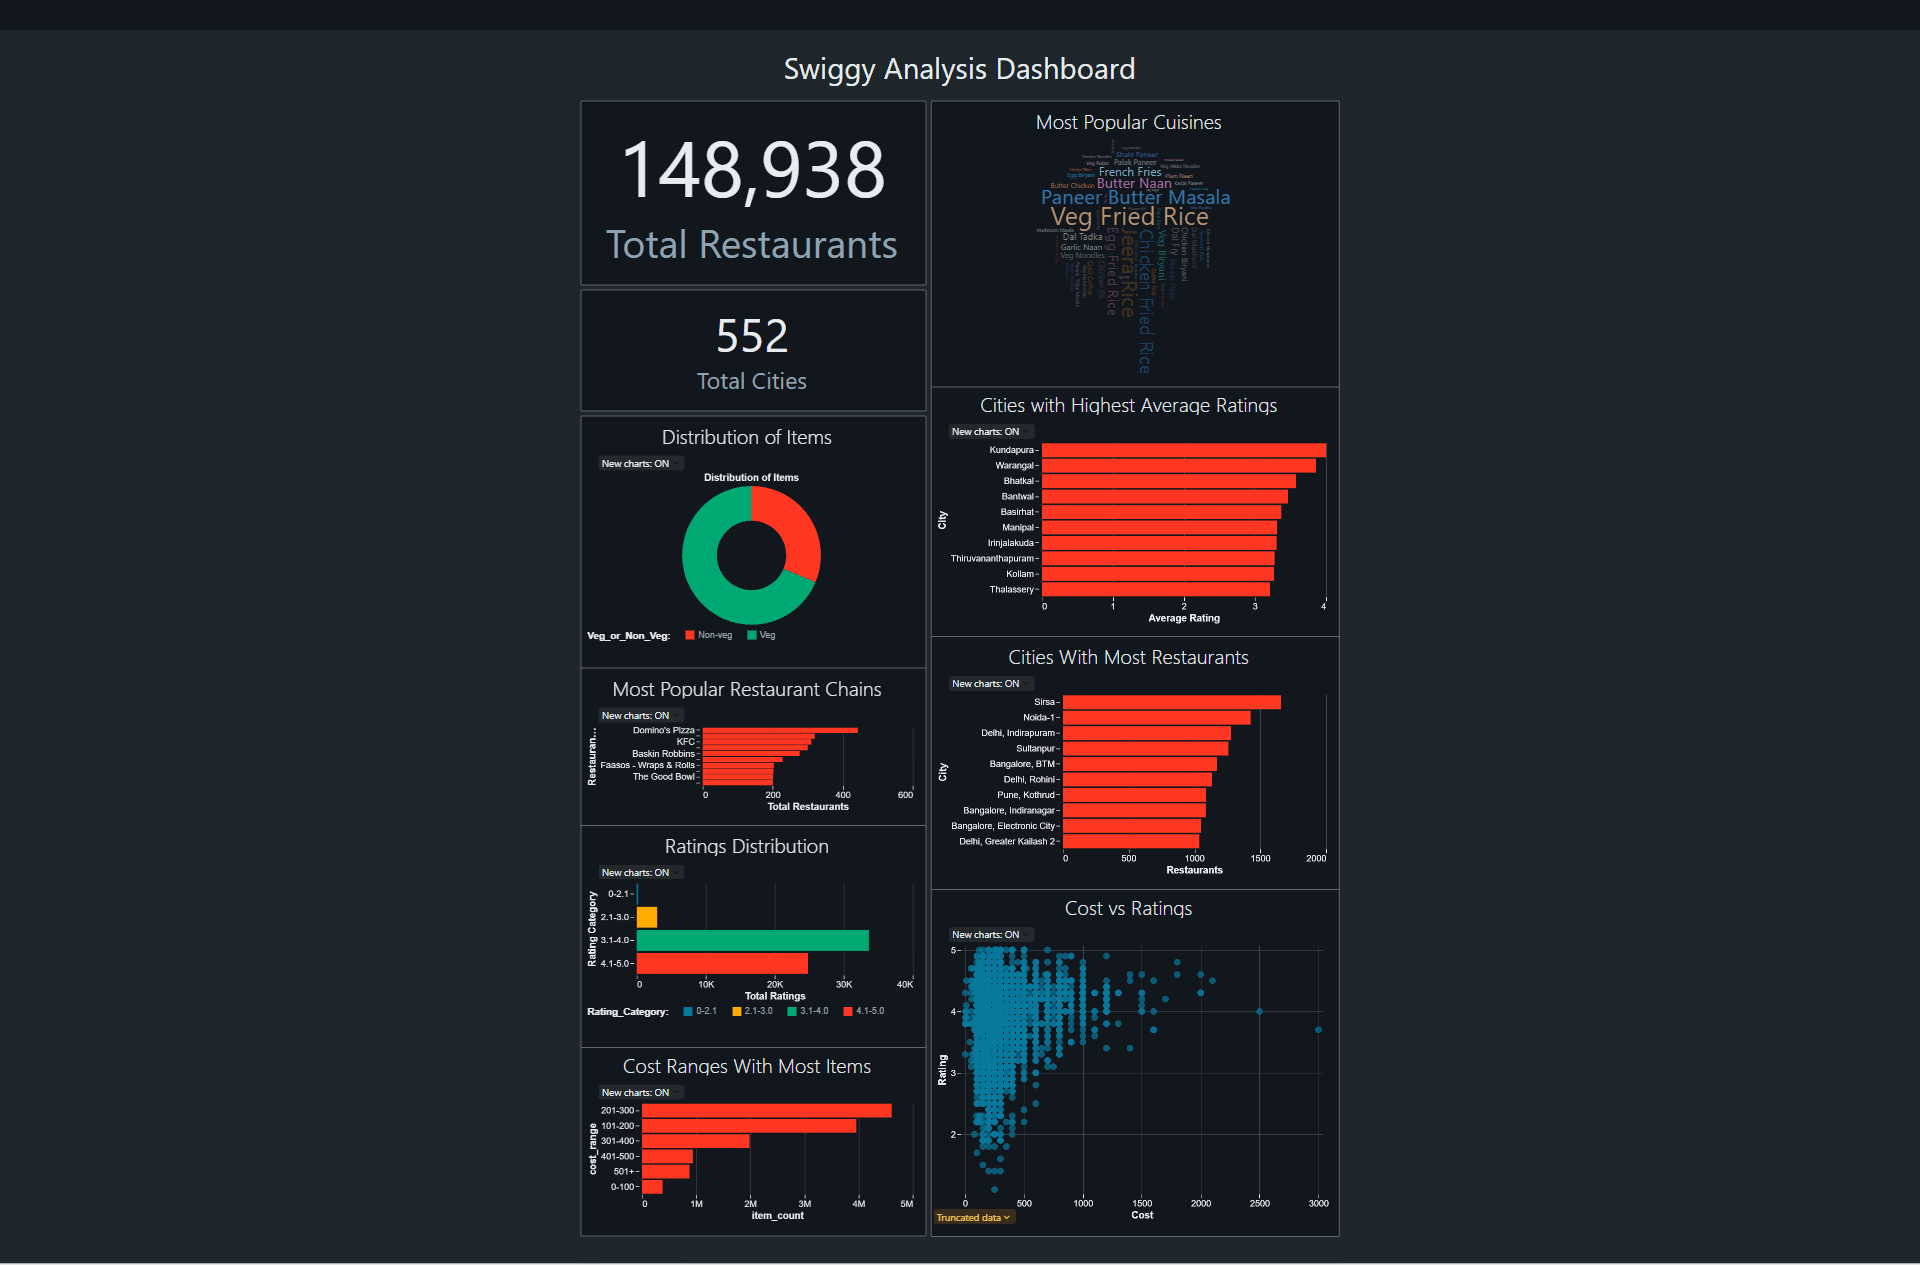
Dashboard
Tools Used
- Python 3.8
- PySpark
- Azure Data Factory
- Databricks (for transformations and visualization)
- Azure Data Lake Storage Gen2
- Azure Key Vault
- Azure Log Analytics
Pipeline Workflow
1. Data Ingestion
- Data is ingested from JSON, CSV files containing restaurant details using Azure Data Factory.
2. Data Transformation
- Null Handling: Missing data replaced or flagged for validation.
- Rating Count Conversion: Convert fields like
50+ ratingsinto numerical values. - Cuisine Parsing: Identify and process multiple cuisines for restaurants.
- SQL Queries: Execute Spark SQL for custom queries.
3. Audit Logging
- An audit table logs pipeline executions with fields such as process ID, start time, end time, errors, etc.
4. Visualization
- Generate dashboards for insights.
Results
- Insights into restaurant trends and performance.
- Improved data quality and accuracy.
- Real-time monitoring with audit logs.